March 31, 2013
About two weeks ago I submitted a post on reddit to try to garner some feedback from the community, and I actually got a few responses. Immediately, the biggest issue that came up seemed to be the lack of a way to find a particular game. I had my suspicions on this already, but it was good to see this validated as a big problem. Another issue that stuck out was that you have this chart on the game page, but if you want to refer to data outside of the default 48 hour window, the user would have to be told to click the specific timespan after visiting the page.
 There were simple answers to both of these: search, and permalinking to chart timespans. The search bar sits at the top right of the page, and regarding the chart, the URL in the address bar should update as you change timespans. Check out the last 3 months of Natural Selection 2. Nice free weekend, huh?
Thanks to this feedback, the site's usability is far greater than before. Still, I'd say there's lot to be desired and there's much more I plan to do in the future. For example, the front page is a bit of a mess of numbers, it would be nice to compare games to eachother, and perhaps aggregate games into comparable groups like genres, publishers, developers, etc. Maybe that's for another article.
I await more feedback! Maybe you're having a problem, or you see a better way to visualize or interpet the data? Leave a comment on Trello, reddit, or via Twitter.
January 20, 2013
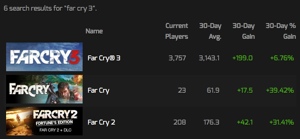
Steam Charts is an experiment with Steam's player numbers. Player count data has been collected from Steam since July 2012, and a frontend was first put together in December 2012. The idea behind this is to see the long-term trends of game popularity on Steam.
You can already see some notable trends with only 6 months of data. For example, Dota 2 has the strongest player base ever seen on Steam, and is still growing strongly as of this writing. Counter-Strike continues to be strong, but CS:S seems to be losing some of its player base to CS:GO.
To me this sort of data seems valuable, especially as time goes on. It would be great to see more of this sort of data available in the rest of the games industry. With this data, there are some interesting things to consider in the future, such as adding news event markers, or comparing more than one game on the same line graph...say CS:S vs CS:GO.
This being a bit of an experiment with data, I'd love to hear your feedback. Also, as you interpret the data around the site, if anything is unclear at all, or if there are any technical issues, please let me know. You can do this by commenting on the Trello board or via Twitter.
A few things to note: This data includes all games available on Steam, not just the top 100 from Steam's stats page. Sometime I'll have to write a more technical post about how the data is collected. The main limitation is that the number of players for each game is collected once an hour, which means during any given hour there could have been many more players than when the data was collected, but over time (and in aggregate) I would say the margin of error here is insignificant.
All data is
powered by Steam. Not affiliated with Valve in any way. All trademarks are property of their respective owners in the US and other countries. Our goal is to provide unique insight into gaming trends. © steamcharts.com